
In the past few years, many institutional investors have increased their exposure to illiquid assets. This raises the question of how much illiquidity an investor can handle without letting its risk profile change substantially after a financial shock. Aegon Asset Management’s Investment Solutions Center has taken a closer look.
By Sibrand Drijver & Niek Swagers, Aegon Asset Management
Approach to evaluate liquidity constraints
There are of course limits to the amount of illiquid assets that an investor can tolerate. Pension funds and insurance companies need to be able to meet their obligations at all times, not just their regular liability cash flows, but also their collateral obligations for risks have been hedged by derivatives. This is particularly important under the European Market Infrastructure Regulation (EMIR). Problems could also arise when rebalancing the investment portfolio. Given that there are limits to an illiquid asset exposure, the logical question is: what are these limits? In other words, what is the ‘illiquidity risk appetite’?
Although the answer to this question will differ from one investor to another, the purpose of our study is to provide guidance to answer this question. Essentially, the approach is to put the investor’s investment policy into a model, classify the degree of liquidity of the asset classes, and then define and test a number of stress scenarios. These three steps are explained in more detail below. We will also argue that the method we used is a prudent one.
Modelling an investment policy
First, an investor defines its return objectives and decides how much risks it wants to take. Its risk appetite is a natural starting point for constructing a strategic investment portfolio, including upper and lower allocation limits. These limits are to prevent the actual investment portfolio from deviating too much from the original objectives. To test how much illiquidity an investor can handle, we specifically studied the impact of those allocation limits. Although an investor may still have sufficient cash available to meet its payments, the situation may occur that the portfolio is no longer in line with the original strategic objectives.
Our analysis also takes the investor’s policy into account for hedging interest rate and currency risks. Some investors may use a dynamic interest rate risk hedging policy. If interest rates go up to a certain level, they increase their hedge level and need to buy more interest rate swaps. Therefore, this type of dynamic policy affects the liquidity requirement for collateral if rates continue to rise.
Classification of illiquid asset classes
In practice, there is a sliding scale on which to classify assets as liquid on one end of the spectrum and illiquid on the other. Some assets can be sold at market prices within a few days. Other asset classes will take a few weeks, months, or even years to sell. For the purpose of this study, we treat asset classes as either liquid or illiquid. The illiquid assets in our study are direct mortgage investments, private equity, private debt, and direct real estate.
Scenarios to test sensitivity to factors
The study uses scenarios to test the impact of changes in interest rates, exchange rates, equity prices, and credit spreads. These are the factors to which most pension funds and insurance companies are the most sensitive. In each period, we apply the financial market shocks simultaneously.
Impact of scenarios on illiquid assets
The model continues to apply combined financial market shocks until the portfolio exceeds the allocation limits and can no longer be rebalanced to the strategic weights. In each period, following this shock, we apply the investor’s policy. For example, we hedge the interest rate and currency risks in accordance with its policy, allowing of course for pension or insurance payments, and the cash payments that are needed to post collateral.
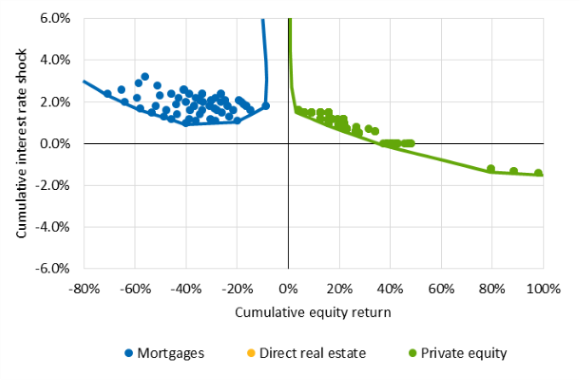
Figure 1 shows the study results for an average Dutch pension fund, based on the statistics published by the Dutch Central Bank. A dot in the chart represents an illiquid asset class that exceeds its allocation limits after a continuous period of shocks in interest rates, equity prices and credit spreads. This shows that, for example, mortgages need to be sold and rebalanced to their strategic allocation after periods of drops in equity prices up to 20% and interest rate and credit spread shocks up to 1%. The approach is based on a period-by-period change in equity prices, interest rates and credit spreads. Each period, the equity price drops with 2%, the interest rate increases with 0.1%-point and the credit spread decreases with 0.5%-point. In this example, the allocation to mortgages turns out to exceed its allocation limit after 11 periods. The area in the chart without the dots will not cause any liquidity problems from a modelling point of view.

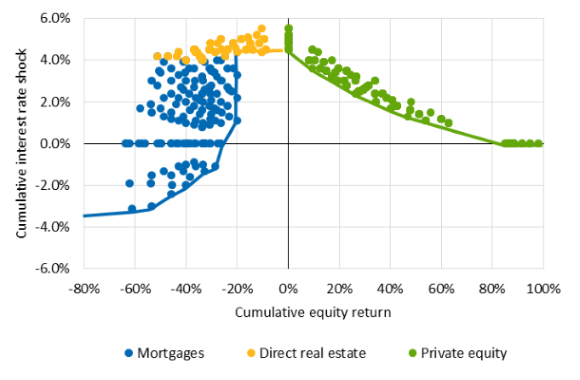
Figure 1: Illustration for an average Dutch pension fund of the illiquid investments that exceed their allocation limit after changes in equity prices, interest rates and credits spreads. Source: Aegon Asset Management, as of April 2018.
Figure 2 shows the study results for an average European life insurance company, based on data from EIOPA and EY. This chart shows a smaller area without dots than for an average pension fund. Typically, insurance companies have a higher allocation to fixed income and a higher interest rate hedge than most pension funds. The subsequent larger amount of interest rate derivatives in the portfolio results in higher liquidity requirements for collateral when interest rates increase. This makes the allocations in the portfolio of insurance companies more sensitive to interest rate and credit spread shocks. Insurance companies might also use “return / matching” balance sheets, where the assets to match the liabilities and the assets to generate returns are split into two separate balance sheets. This can reduce the amount of liquidity constraints.