
By Hamlin Lovell, NordicInvestor
Many liquid systematic strategies are intended to provide a diversification benefit for other hedge fund strategies or long only portfolios. RPM Risk & Portfolio Management AB in Stockholm, Sweden, allocates to a portfolio of systematic managers that has generated some profits in 2020, though not as much as in 2008. Nordic Investor interviewed Dr. Alexander Mende, Senior Investment Analyst, and Head of Investment Research to find out how different types of systematic strategies navigated the crisis.
HL: Has 2020 brought back “crisis alpha”?
AM: The GCC was definitely a crisis. We define a crisis as a month when the MSCI World TR Index is down 4% or more. As for crisis alpha, RPM Evolving was up in Mar-20, was up in Q1, and is up YTD. However, industrywide, results are not that positive, i.e. large CTAs, as measured for example by the Barclay BTOP50 or the SG CTA, were down in Mar-20 and also in Q1. In general, smaller managers, as measured by the Barclay CTA Index or in the RPM Evolving CTA Fund, fared much better.
HL: Why were returns not as strong as in 2008?
AM: Even if the crisis stretched over two calendar months, it only lasted 15-20 trading days (depending on how you view the first week of Mar-20). This was the fastest eruption and consequently slump in Time Series Momentum (TSMOM), which is the risk factor most CTAs try to capture, since our measuring started in the mid-90s. Thus, given that your typical medium-term trend follower has an average trading horizon of 30-60 (trading) days, the disappointing industry results are not surprising. Once again, the market response to the new economic environment was distorted by central bank action: more money in the system. In other words, trends were for the most part not allowed to fully develop and run their course – when trend followers had reversed their long equity positions, stock markets around the world – led by the US – started to rebound in response to the support packages.
HL: So, the GCC was a much faster crash than the GFC. Within trend following, how have shorter term traders compared with longer term traders?
AM: In aggregate, the RPM short-term sub-strategy was up every single month YTD and the SG STTI index was also up in Jan-, Feb-, and Mar-20 outperforming other CTA strategies. So, the short answer is that short-term traders have done better.
But it also depends on the time period. Shorter term trend following managers performed better in the beginning of the crisis as they were faster in adjusting positions. However, the same managers were also already net short global stock indices, right before the market rebounded and were hurt accordingly. Here, long-term trend followers did of course better as they had not yet fully adjusted their exposure, profiting from the rebound, still being long equities. Thus, on the whole month of March, performance was mixed but similar in absolute terms.
Judging from the short-term traders we monitor, this was also the sub-strategy with the widest dispersion, i.e. our best manager was up 16.9% in Mar-20 whereas the worst manager was down -27.1% and had to be closed before the month was over.
HL: Given the transparency you get from managed accounts, how did manager exposures vary during the month?
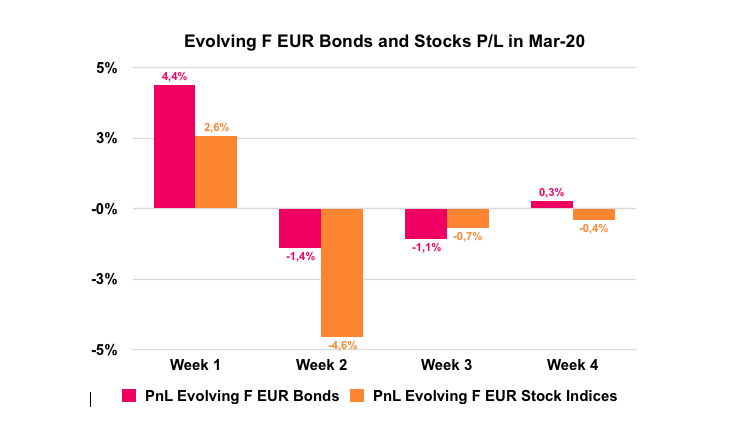
AM: To understand the GCC and grasp why CTAs performed the way they did, one would need to go through the events on a week-by-week basis. We show this both from our logs and a chart showing RPM Evolving sector performance in fixed income and equity markets.
Figure 1:
Mar-20: Coronavirus Week-by-week Log
Week | Market Action: | CTA Positioning: |
1 | Stocks volatile (but up), VIX spikes, bond yields touch record lows, and US dollar loses ground against major currencies amid increasing fears that coronavirus pandemic would spread further triggering expectations about intramonth cut by Fed. | Simplifying things by focusing only on portfolios’ equity and bond exposure, CTAs are generally long and profiting from both sectors. |
2 | After Trump bans Europeans from entering US, crisis becomes real panic as equities ex-perience worst week since 1987 crash and VIX jumps to levels not seen since 2008. Dollar rallies and bond yields jump as panic-stricken investors seek safety of cash. | ‘Long bonds’ doesn’t work: CTAs still being long equities and, now, even longer bonds suffer in both sectors. |
3 | Stocks continue lower despite Fed slashing target rate to zero. VIX reaches all-time high before dropping back. Greenback continues to strengthen whereas yields remain rangebound. | By March 17th, less than 20 trading days after initial Feb sell-off, RPM portfolios are net short equities; long bond exposure has been reduced; performance is slightly positive due to other sectors. |
4 | Upside down! Despite unparalleled surge in US jobless claims, stocks rebound whereas VIX continues to fall amid US$ 2tn stimulus package to counter economic impact of Covid-19. Yields fall as investors return to safety of government bonds. Dollar records its biggest weekly drop in more than decade after Fed expands swap lines with other central banks to ease demand pressure. | CTAs now short equities and less long fixed income are down as losses in stock indices outweighed gains in bonds. |
Figure 2: CTAs’ Weekly Performance Attribution, Split by Stocks and Bonds, in Mar-20
HL: Have “tail risk” strategies performed as expected, better than expected, or worse?
AM: Performance seems to be widely dispersed among managers once again. We have exposure to relative value traders and directional volatility managers that can be either long or short. Those managers were slightly down during the GCC but not as much as the SocGen VTI benchmark and in line with expectations.
HL: Have fundamental traders done better or worse than technical traders using price signals?
AM: The very largest systematic fundamental managers have lost money this year. But our systematic fundamental managers are, in aggregate, the best performing sub-strategy YTD. We only invest in smaller, nimble and – hopefully – more innovative managers.
HL: How have machine learning strategies performed?
AM: We had one short-term trading manager applying ML, which had to be closed mid-March due to risk and drawdown breaches. The problems are “data mining/fitting” and “out-of-sample analyses”. The more “fine-tuned” a quant program, the more vulnerable it is to new unprecedented market environments and shocks. Given that this was the steepest decline in stock markets since Oct-87 and there was not much daily data around in those days, I guess, that there is no system that could have been trained for the events in Mar-20, especially the 2nd week when the long-term equity-bond-precious-metals-diversification relationship collapsed.
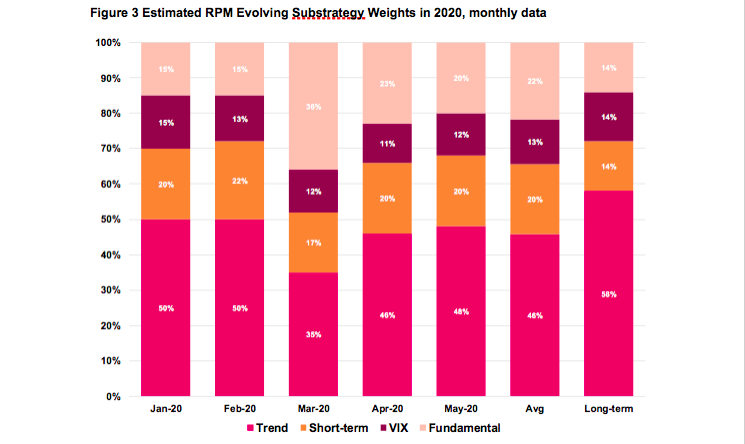
HL: How has dynamic risk management through your active overlay helped in 2020? How has your strategy allocation among short term traders, trend followers, systematic macro, and VIX changed?
AM: The portfolio substrategy weights are steered by our manager allocations as well as managers’ own actions. Please note the significant underweight of trend following in Mar-20. Regarding RPM actions, horizontal manager and vertical leverage adjustments are driven by (inhouse) indicators and portfolio risks. In general, due to warning signals by inhouse indicators, we continuously decreased portfolio risks, especially by reducing trend following managers’ allocations, between mid-Feb and Apr-20. This vertical tactical risk decrease was quite successful adding 139bps to overall performance.
Since mid Apr-20, the portfolio is back at long-term target risk. And since May-20, sub-strategy weights are roughly back in line with long-term averages, although trend and VIX are still somewhat below.
HL: What is your typical portfolio turnover?
AM: Since RPM Evolving launched, we have on average added three new managers each year and redeemed from three. We currently have 11 programs in the portfolio.
HL: You find that smaller managers have outperformed. What are the smallest and newest managers you would allocate to?
AM: Currently our median manager runs US$ 300 million and the largest runs US$ 700 million. Capacity varies by strategy so US$ 500 million would be too big for a VIX trader but US$1 billion could be fine for a trend follower. Since the CTA industry has shrunk we might go as low as USD 9 million. We want to see at least one year track record and ideally two or three years of daily data. This could be trading with proprietary capital, and managers may also have longer track records from their previous employers. Having said that, we are not seeding funds nor taking equity stakes. We invest through separately managed accounts, and we are usually not the first investor in a managed account. The climate is difficult for startups but there are third party platforms that can help by handling legal and operational matters.
HL: Where do you find these managers?
AM: Locations range from Australia, to Hong Kong, Europe including Sweden, Switzerland, France, and the UK, and all over the US as well. We run several algorithms that regularly scan the Barclay Hedge/CTA database for new entries and strong performing managers. Of course, before Covid-19, we regularly participated in CTA conferences to get to know new managers.
HL: Has the GCC changed your due diligence process?
AM: Pre-Corona we visited them all. Recently we have done video chats, including Onsite DD via Zoom or MS Teams, where they show us their office and trading platforms. We do think it is important to meet them at least once and, often, we have known the principals from their previous companies.
HL: Are you invested in any ARP (alternative risk premia) strategies charging flat fees, or alternative ETFs in volatility or other strategies?
AM: No, we believe in manager skill, especially with regards to risk management and innovation. For us it is essential that a manager keeps refining and enhancing her trading system continuously.
HL: Is it worth paying full hedge fund fees for all types of quant strategies?
AM: What fee you pay depends on your negotiation skills. We have some managers charging 0% management fee and 30% performance fee, others at 0.5% management fee and 15% performance fee. We always prefer to reduce management fees and pay more performance fees. Equally some managers will still charge traditional hedge fund fees of 2% and 20%.
HL: Which strategies are you looking to add now?
AM: We are in the process of adding a tail risk volatility strategy and are researching some pure commodity traders.
HL: How is your own overlay process developing?
AM: We are refining our own models for dynamic allocation, such as timing allocations to trend following CTAs.