
By Hamlin Lovell, NordicInvestor
Bears have been calling the top for years now but US equities keep on making new highs, but Norges Bank is increasing its allocation. Whether equities appear expensive or cheap depends on the definition, and varies greatly by regions, factors and sectors.
Countries
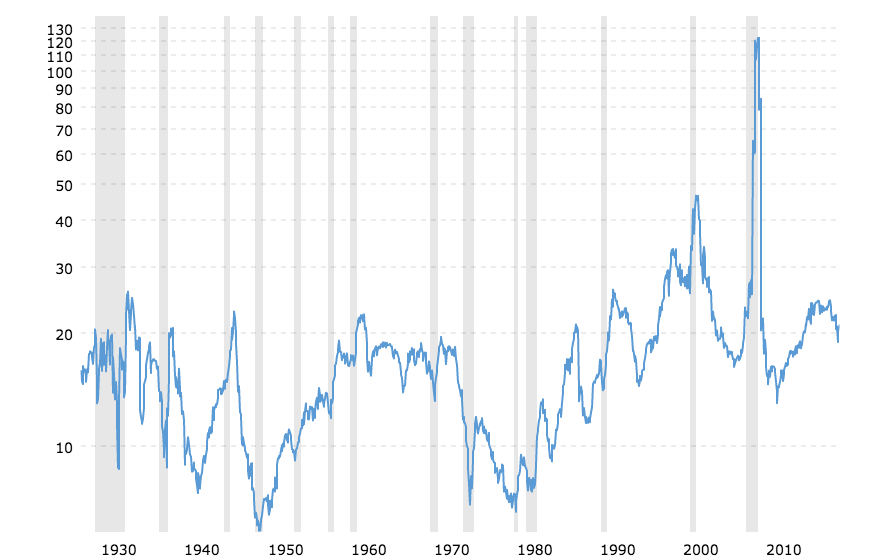
US equities are not on particularly high valuations in absolute terms: the PE ratio just above 20 is a bit above its long run average, but not at extreme levels:
US equities may even be considered cheap relative to bonds: in August 2019, the dividend yield on the S&P 500 index is slightly higher than the yield on ten-year Treasury bonds, for the first time since the great financial crisis in 2008. This is remarkable because income from bonds is fixed whereas dividends tend to grow over time.
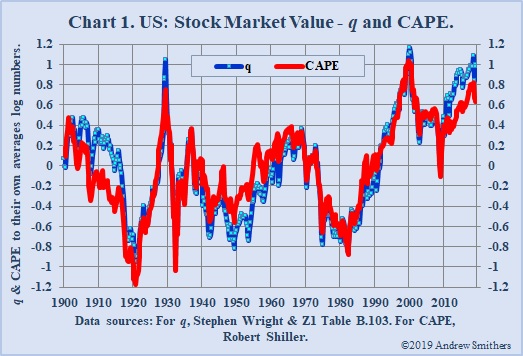
US equities are deemed expensive when profits are cyclically adjusted, as below. The Shiller CAPE is around 1929 levels and was only higher in 2000 at the climax of the TMT boom.
The bearish argument is that the profit share of GNP is unusually high, partly due to US corporate tax cuts, and should at some stage mean revert. This could happen if US corporate tax rates go back up, which might occur if a Democratic President wins in 2020. Profits may also suffer if workers get a higher share of GNP, and this might happen if the US meaningfully restricts immigration. There are already signs of labour shortages in certain skillsets and parts of the US.
Crossing the Atlantic ocean to the UK, valuations are much lower. UK equity valuations relative to other global markets are at a 30-year low, according to Man Group Man GLG’s Henry Dixon. The FT All Share index stands at a 25% discount to the FT World Index. The dividend yield on the UK market, approaching 5%, is roughly five times the ten-year government bond yield of around 1%! This partly reflects the twin fears of a Hard “No Deal” Brexit, and a Corbyn Labour Government, which may in fact be a much greater threat than Brexit for some sectors that could face nationalization with uncertain compensation. Sentiment towards UK assets is near all-time lows, according the BAML Global Asset Manager Survey.
European equities on a PE ratio of around 12-13 times are at a five-year valuation low. Europe is usually cheaper than the US partly because the US has a higher weighting of growth sectors such as healthcare and technology, which command higher valuations. Dividend yields in Europe are close to 4% while the great majority of government bonds now have negative yields, and corporate high yield debt pays only about 3%.
Emerging market equity valuations – on a PE ratio around 12-13 times – are also historically towards the low end of the range, and also at a wide discount of around 25% to developed markets. Let us not forget that emerging markets have sometimes even traded at a premium to developed markets!
The cheapest equity markets globally are generally in emerging and frontier markets. They include Russia, Ukraine, Poland, Turkey, Egypt, and Pakistan, some of which we have covered in our frontier market focus series. One market really stands out this summer: Argentina’s stock-market crashed by 48% in a single day on August 13th 2019 – the biggest crash of any stock-market globally since 1950; its currency has also fallen by about 30%, on fears that Peronists may regain power.
And the MSCI World Emerging Markets Equity index is still below the previous peak it reached in 2007, as are European equities if dividends are ignored. The US has outperformed over the past decade primarily because US corporate profits have grown much more than those in emerging markets or Europe, but also because the valuation ascribed to those profits has expanded.
Factors
Valuation dispersion in US equities has hit the widest levels in 70 years, according to AB Bernstein. The most expensive 20% of MSCI US stocks are trading on PE ratios of around 50 times, while the cheapest 20% are on PE ratios of below 10 times, as of early 2019.
This is partly a function of the bifurcation between valuations of growth and value stocks. Growth has outperformed value for the past ten years, in a global trend across geographies, sectors and market cap sizes.
The quality factor has also become richly valued, and it may overlap with high ESG scores, in some cases.
Sectors
In the US market, financials, materials, energy and industrials are trading towards the lower end of their historical valuation ranges, measured by PE ratios.
Meanwhile, two categories of sectors are trading at the high end. Utilities and consumer staples are in some cases seen as “bond proxies” which are riding the bull run in bonds. Their valuation premium to the US market could be as high as 40%, according to a Fidelity paper.
And technology also trades at a premium, but it has clearly been the locomotive of earnings growth for the market.
In Europe, there are some similarities. Defensive quality stocks such as Nestle or Unilever are trading on PE ratios above 20, and may be in the most expensive 1% of their history. This is not surprising given negative government bond yields, but if interest rates ever normalize, these stocks could start to look expensive.
Cyclicals are lagging behind, with many large cap German stocks on single digit PE ratios.
In the UK market, there is a gulf between globally focused multinationals and domestically focused stocks. A high proportion of domestically focused small and mid-caps in the UK are trading on PE ratios below 10.
So, in the simplest terms, US growth and quality stocks, including some technology firms, are possibly on relatively high valuations, and to some extent the same factors are highly valued globally. Meanwhile many UK, European, emerging market and frontier market stocks – including more cyclical and domestically focused sectors – could be on historically low valuations. There could even be parallels with the market landscape seen 20 years ago in 1999 at the peak of the TMT bubble, but the divergences are not now as extreme as they were then.